Key takeaways
- Dashboards arrived on 9 September 2026 and are built by dragging and dropping onto a grid.
- The cap is 15 cards per dashboard on standard properties and 30 on Analytics 360.
- Six visualisations are supported: scorecards, tables, line, bar and donut charts, and funnels.
- They support neither segments nor per-card comparisons, and have no API access, so they do not replace explorations.
What are Google Analytics dashboards?
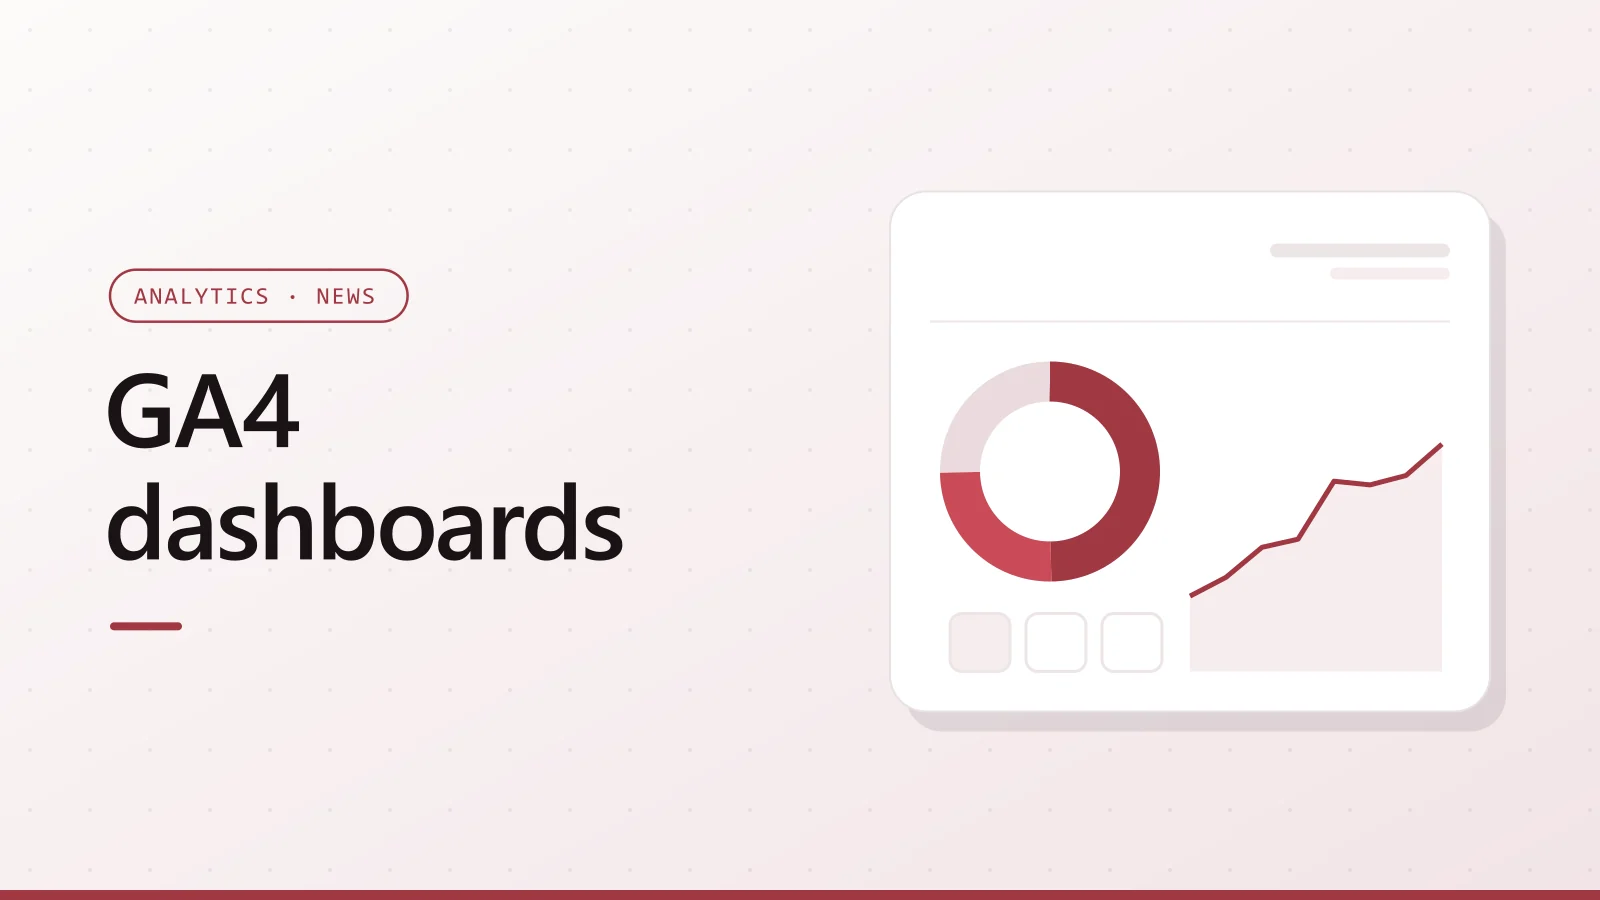
Google Analytics dashboards are a grid-based reporting surface where individual visualisations are placed until they form a single view. Assembly is manual: drag a dimension or a metric onto the canvas, position the card and resize it. A side panel controls the formatting of whichever element is selected.
Six visualisation types are available: scorecards, tables, line charts, bar charts, donut charts and funnels. The funnel matters most to anyone tracking conversions. It shows the drop between steps without leaving the page.
The fifteen-card cap
Each dashboard takes a maximum of fifteen cards on a standard property. Analytics 360 properties, the paid tier, go up to thirty. It is the first reporting feature of 2026 that Google tiers by licence, and the detail matters more than it first appears when planning the work.
Fifteen cards make a decent board-level view: sessions, users, conversions, revenue, the top five channels and a funnel. They do not cover a product-by-product dashboard or a campaign with many variants. That means splitting across several dashboards, with the loss of context that brings.
Who can create them and who sees them
Creating and publishing a dashboard requires the Editor or Administrator role on the property. Viewing one only requires access to that property. One point is worth settling before starting: every published dashboard is shared with the whole property, with no option to keep one private.
Across a team of several people that forces a naming convention, agreed before six dashboards called «test» appear. It is a small discipline that saves awkward clean-ups later. Where a dashboard is used to justify campaign spend, the names should match those used in paid ads.
How do they differ from explorations?
Explorations remain the analysis tool and dashboards are the communication one. The technical difference is specific: dashboards support neither segments nor comparisons within each card, and offer no API access. The first limits analysis; the second rules out automating extraction.
That missing API has a practical consequence for anyone sending periodic reports to a client or a board. The dashboard is read inside Analytics, but it feeds no spreadsheet and no external dashboard. Those still need the usual tools.
When one is worth building
A dashboard pays off where there is a recurring question and a fixed audience. A board looking at the same picture every Monday is well served by fifteen cards. The same goes for a store manager watching four numbers and a funnel.
It does not pay off where the question changes weekly, where segments need comparing, or where the data has to leave Analytics to be matched against sales. There the dashboard falls short by design. The work belongs to explorations or to a separate dashboard, like the ones we build in analytics and CRO projects.
Where to start
The most profitable half hour is spent writing down the questions the team repeats every week, then building one dashboard that answers them. Fifteen cards force a choice, and that constraint usually improves the result. If the dashboard fills up before answering everything, the signal is clear: there was no agreement on what gets measured, and more charts will not fix it. On a site already watching its Core Web Vitals, the same habit of picking few metrics and sticking to them works just as well.
Frequently asked questions
How many cards does a Google Analytics dashboard allow?
Fifteen on standard properties and thirty on Analytics 360. The cap applies per dashboard, so a larger board has to be split across several separate dashboards.
Can dashboards be private?
No. Every published dashboard is shared with the property, and anyone with access can see it. Agreeing a naming convention before the team starts creating them is worth the five minutes.
Do dashboards have an API?
They offer no API access, so their contents cannot be extracted automatically. Feeding a spreadsheet or an external dashboard still requires the usual export routes.
Do they replace explorations?
No. Explorations support segments and comparisons that dashboards lack. Dashboards communicate a stable view to a fixed audience; explorations are for analysis when the question keeps changing.